Sales KPI Dashboard
Dataset
The dataset contains sales record of a hypothetical store selling products in the categories of Furniture, Office Supplies, and Technologies to different customer segments.
Summary
The goal of this project is to build dashboard that helps stakeholders with strategic decision making. The dashboard utilizes sales data to show:
- Top-level revenue, profit, average profit ratio, and units sold.
- Year-over-year performance by customer segment.
- Monthly trend by customer segment.
- Category Performance.
- Best performing sub-category within each customer segment.
Design
All visuals utilize a color-blind-friendly palette, with effective use of color to call attention to the important points in the visualizations. Navigation is made easy with clear use of alignment. Finally, a text hierarchy is utilized to organize the information on the screen.
Screen Shot
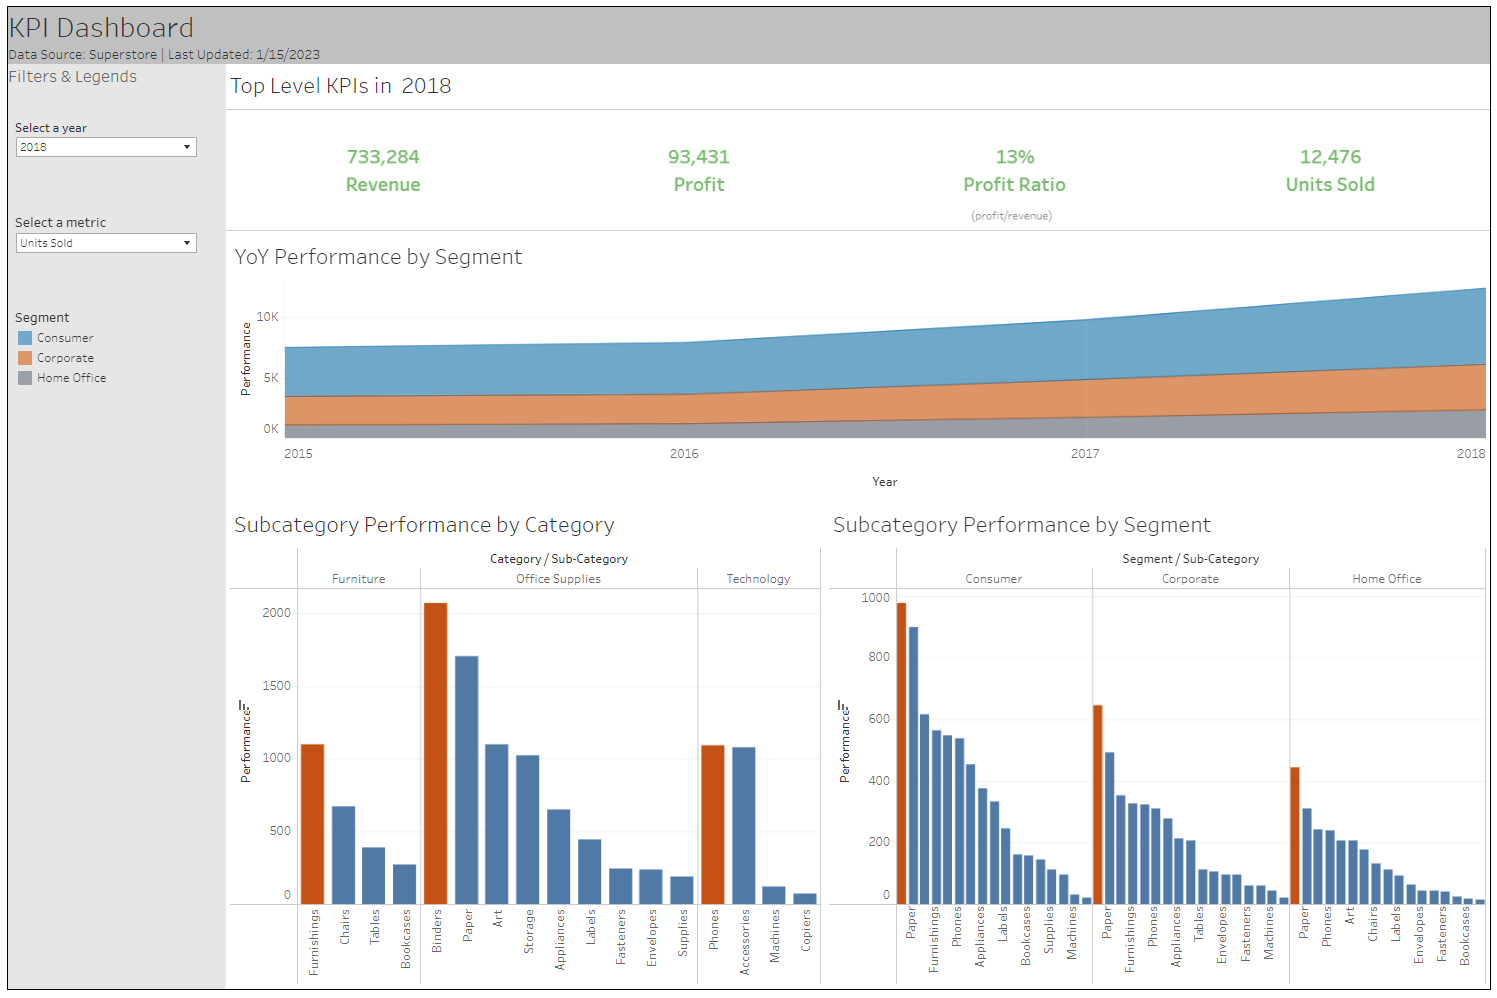
Screen Shot of the dashboard, for the full interactive version see the link below
Tableau Public Link:
The dashboard is published on Tableau Public, you can use it interactively using by clicking here.