GDP Per Capita Trends Throughout The Years: A Data Story
Dataset
The dataset is a world development indicators dataset containing annual data about 217 countries covering the period from 1990 to 2014. The data is a compiled version from multiple sources from the World Bank.
Summary
The aim of the project is to study global historical trends by building a coherent narrative around the data through a Change Over Time story. The story describes how GDP growth changes across time and regions.
Design
The story features five snapshots that are described by a sequential narrative on the text tabs showing above the visualizations. The story provides a finer control through time by using a time slider that allows for navigating to any year covered by the data. Finally, the seven regions in the data are color coded for clarity.
Screen Shot
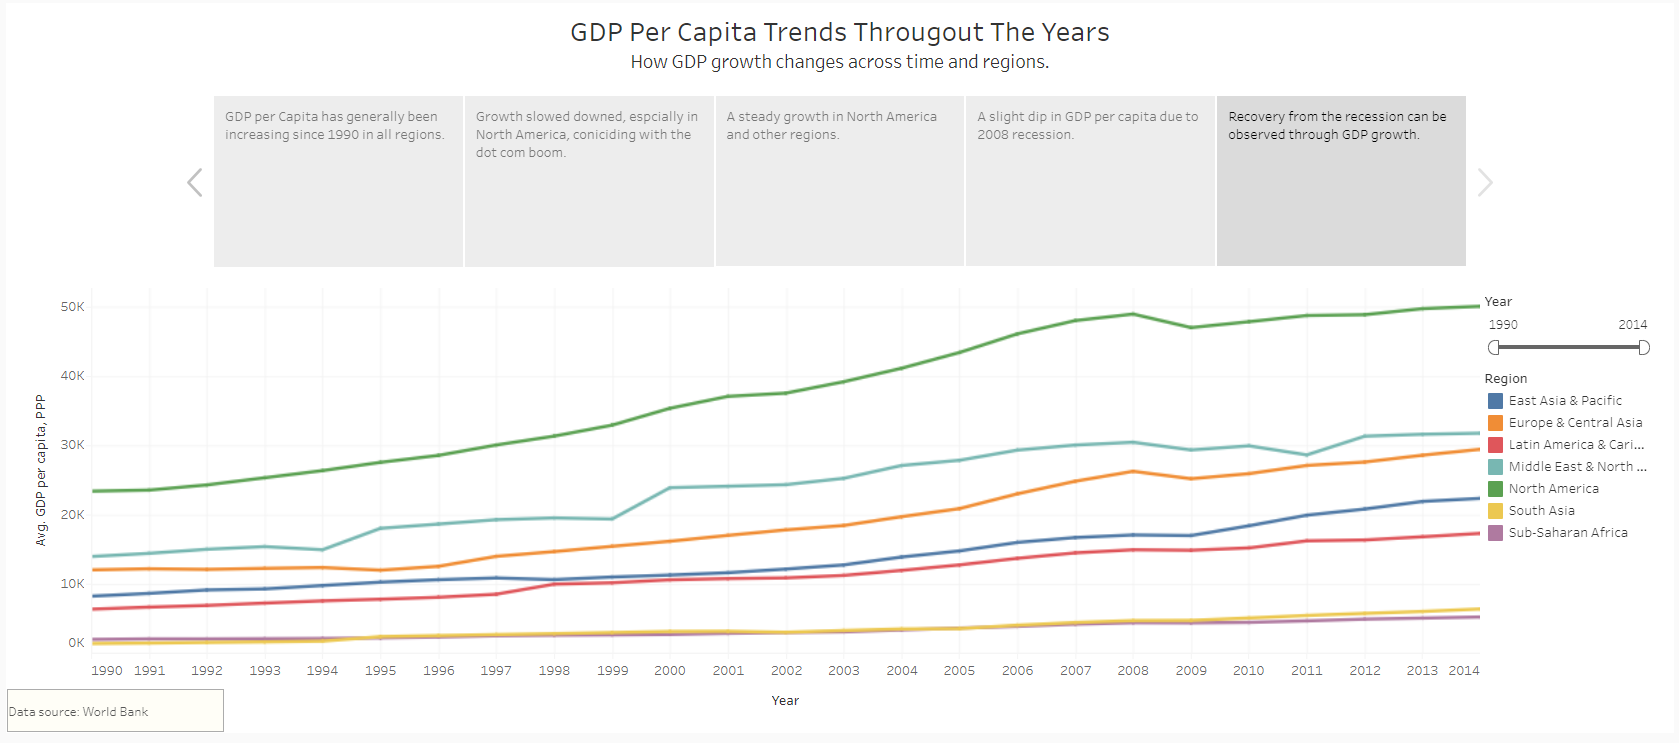
Screen Shot of the Data Story, for the full interactive version see the link below
Tableau Public Link:
The stroy is published on Tableau Public, you can use it interactively using by clicking here.