Richer Nations, Higher Power Consumption: A Data Story
Dataset
The dataset is a world development indicators dataset containing annual data about 217 countries covering the period from 1990 to 2014. The data is a compiled version from multiple sources from the World Bank.
Summary
This project tells the story of the relationship between GDP and Power Consumption through an animated Bubble Chart. The Bubble Charts is inspired by the late Hans Rosling Famous Ted Talk. The story features three snapshots of the data that follows the change of power consumption of multiple countries like Saudi Arabia, Korea and Singapore as their GDPs change.
Design
The story is designed by Flourish, a web-based visualization tool. The story narrated and animated and can be view in a video format in the link below. The story provides a finer control through time by using a time slider that allows for navigating to any year covered by the data. Finally, the seven regions in the data are color coded for clarity.
Screen Shot
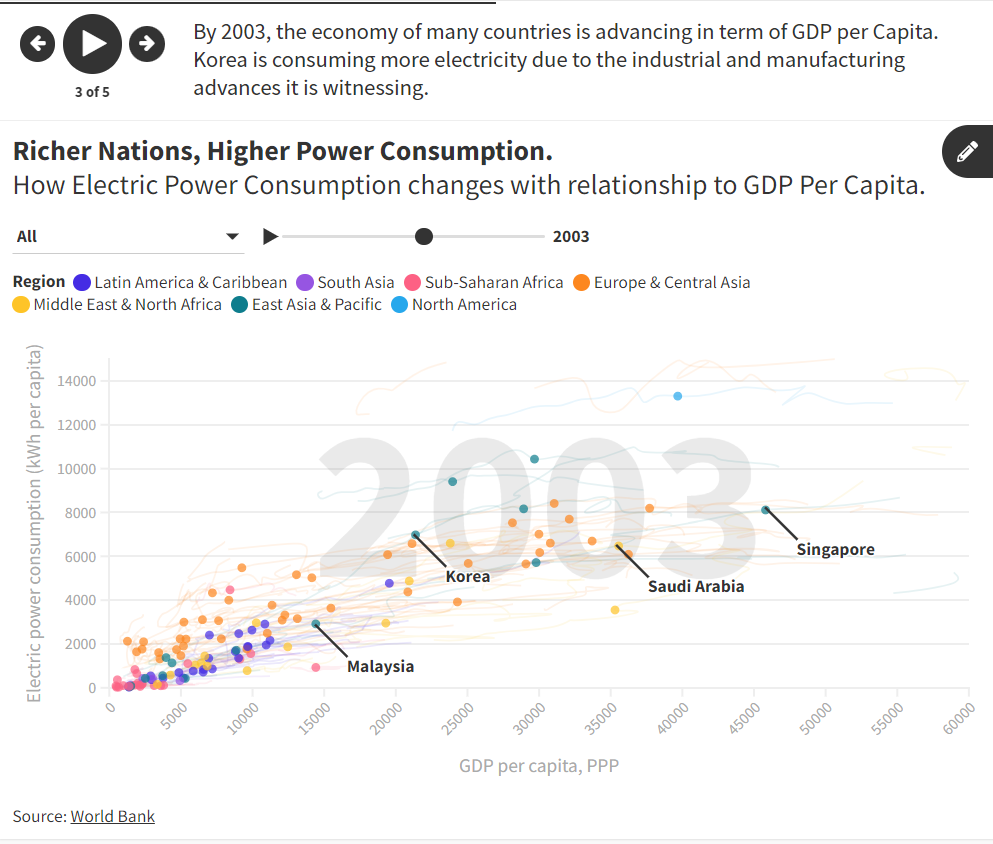
Screen Shot of the Data Story, for the full interactive and narrated version see the link below
Flourish Link:
The stroy is published on Flourish, you can watch it and interact with it by clicking here.